1. ATH timing by halving
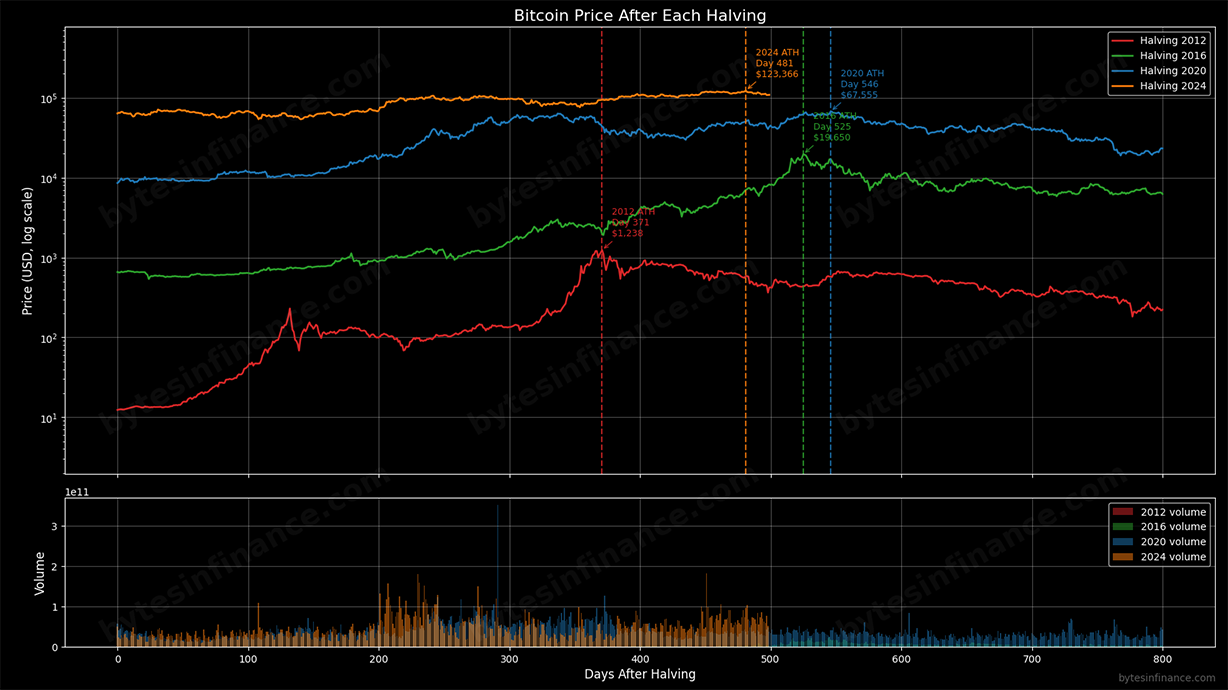
The chart below aligns each cycle to its halving (Day 0) and marks the day the cycle ATH was set: ≈371 days after the 2012 halving, ≈525 after 2016, and ≈546 after 2020. In the current cycle, a new ATH occurred near ≈481 days — earlier than 2016/2020 but later than 2012. That doesn't automatically settle the cycle: it simply places 2024 between the “early” and “late” historical patterns.

Historically, halving cycles have delivered their final highs at different tempos. The current placement around Day ≈481 implies three plausible paths: (A) continuation to a later, higher high; (B) the high is already in; (C) an extended structure (double-top or broad top) before resolution. Timing alone is a blunt instrument; we need volume and breadth to confirm.
2. Volume profile & cycle analogs
The 2020 cycle (blue bars) printed a pronounced volume spike roughly ~250 days before the ultimate ATH, followed by a relative maximum ahead of the final push. In the current cycle (orange), we see a potentially similar setup: a prior burst of activity before a local (relative) high. Analog ≠ certainty, but it’s a useful prior.
- Breakout confirmation: higher highs on expanding spot+perp volume and improving OBV.
- Fail-break risk: new highs on shrinking volume, heavy funding/OOI skew, narrowing breadth.
- Market breadth: leadership broadening beyond a few names usually accompanies durable advances.
If breakouts occur on rising volume with healthy breadth, probability of a later higher high increases (Path A). Conversely, repeated fail-breaks with fading volume elevate the odds that the ATH is already in (Path B), while choppy breadth and alternating squeezes often precede a double-top/extended structure (Path C).
3. Methodology
- Data: daily OHLCV. Prices in USD; cycles anchored at halving dates (2012-11-28, 2016-07-09, 2020-05-11, 2024-04-19).
- Charting: log-scale price for comparability across magnitudes; cohort-colored volume subplot.
- Annotations: vertical dashed lines mark day-of-cycle ATHs (~371, ~525, ~546; current ~481).
- Caveats: exchange coverage and methodology for “volume” differ; treat signals comparatively, not absolutely.
This is descriptive research, not investment advice. Blend with your own trend, volatility, and risk signals.
4. Reproducibility & code
Chart generated with a custom Python script (pandas + numpy + matplotlib). The script aligns cycles by halving date, computes ATH days, and renders the volume subplot by cohort.
Stay in the loop
Quant insights, scripts, and indicators — at most 1-2 emails per month.
